Complex Function Plotter An HTML5 tool for creating complex function plots
See The Project
Project Description
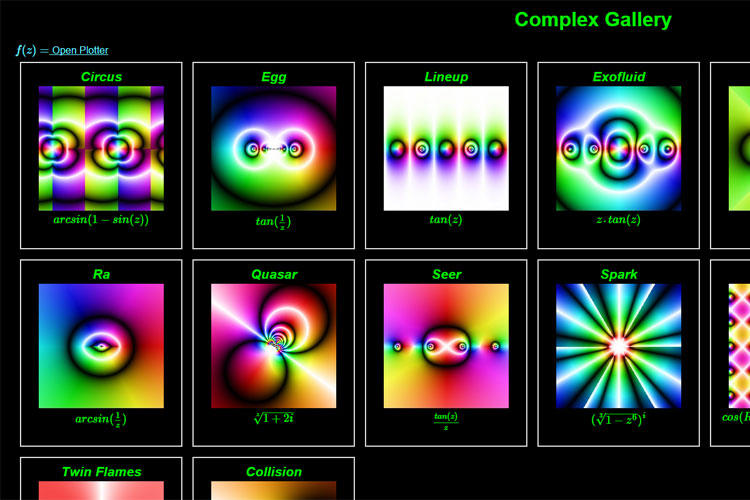
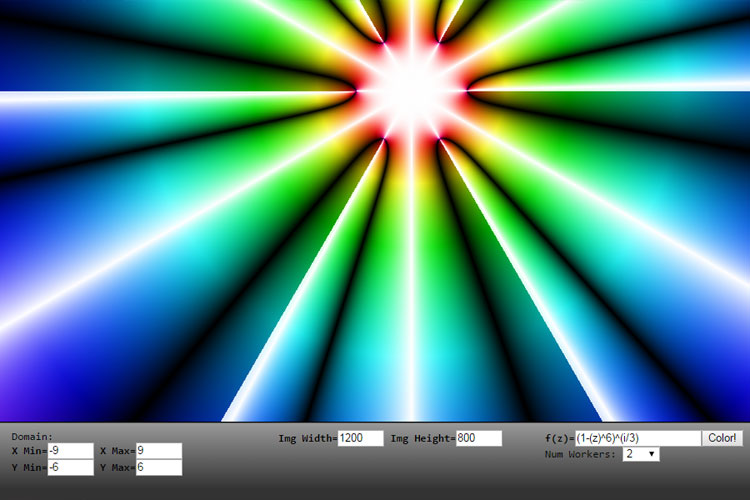
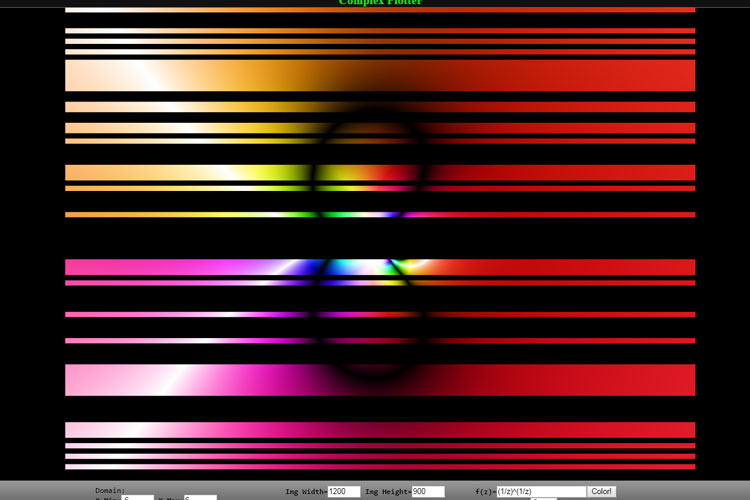
This JavaScript based project will parse a complex function (i.e., a single variable function in the complex domain) and create a plot by iterating through every real and imaginary value in the plot's domain. The output is a color plot in an HTML canvas that is based on the calculated value's magnitude and argument. For more information about complex functions, see the Wikipedia entry on complex analysis.
It utilizes JavaScript libraries mathjs for parsing the functions and MathJax for representing the functions with high-quality math typography. In addition, I made this project to experiment with JavaScript workers, and so the worker class is used to perform the actual calculations in a concurrent fashion. You can use this project by visiting the following link: Complex Function Plotter