Parametric Function Plotter An HTML5 tool for creating parametric function plots
See The Project
Project Description
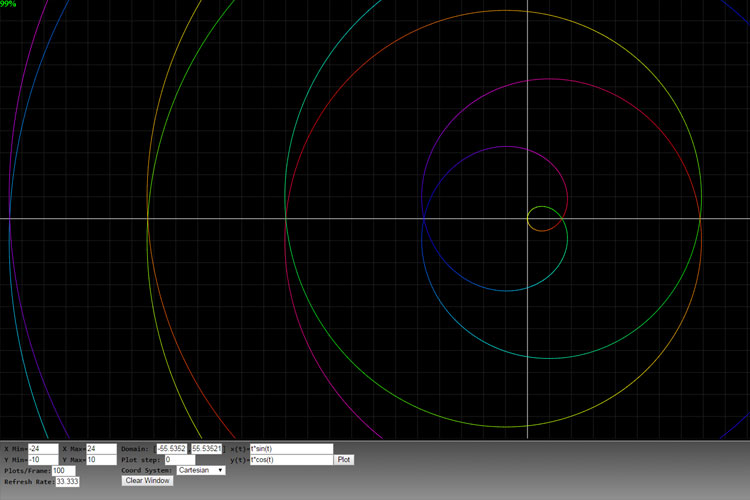
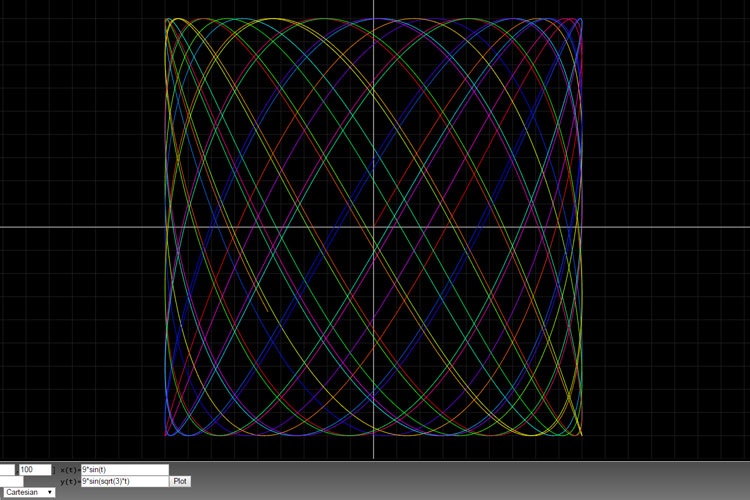
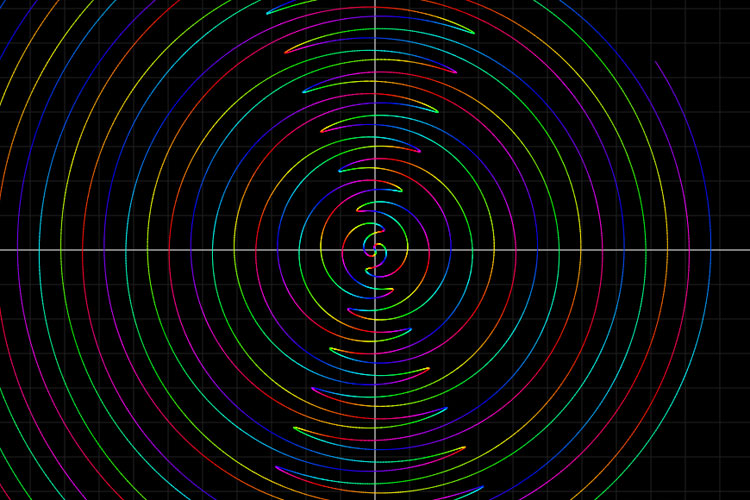
The Parametric Function Plotter is a JavaScript application that will take a pair of parametric equations and produce a plot based on these equations. One equation defines a value for the x position of the plot while the other defines the y position. Both of the equations are calculated using the same dependent variable t. The color of the lines formed is evenly spread through red, green and blue. The program also divides the calculations into a specified number of plots per tick so that one can see their equations slowly come to life.
This project uses the mathjs library to parse the equation text.